Basic concepts and terminology
CxEngage Reporting is a web-based framework for designing informational reports and dashboards. It includes a set of configurable standard reports and dashboards that should cover most of any Contact Center needs.
Dashboards in CxEngage Reporting offer a powerful and insightful way to present Historical Reporting, enhancing your ability to make informed decisions based on your historical data.
The software provides its users with the following features and advantages:
- Customizable display of detailed information about every relevant KPI and data point in your system
- Printable, paginated, shareable reports and dashboards, exportable in several formats
- Customers or Enghouse professionals can create custom dashboards based on the Enghouse adopted framework
User roles
The following user roles are available in CxEngage Reporting:
- Designers: Create, manage, and work on reports and dashboards. They also have the same access rights as Viewers.
- Power Viewers: Work with views and styles based on reports, dashboards, and data models shared with them. They cannot edit other assets in any way. They also have the same access rights as Viewers.
- Viewers: View reports and work with reports and dashboards using filters and settings. Viewers have access to subscriptions and downloads.
For more information on this topic, see User Roles.
Naming Conventions
To see the complete name of your reports or dashboards in the Reports or Dashboards pane, limit the name of your reports or dashboards to 50 characters or less.
Reports
Reports are connected to your data models so that your data can display in meaningful ways. They allow you to see a simple, yet effective overview of all the data you may need. Their design can vary and be customized, depending on your needs.
Reports you can interact with, whether they were created by you or shared with you, are shown in the tiles of the Reports tab. Depending on the design of the report, users can filter the data, adjust some of the settings of the report, focus on the data they need, and perform other actions.
Users can also download the report in a number of formats, print reports, and subscribe to periodic updates via email or other channels.
Standard reports are a set of out-of-the-box reports made to suit the needs of many different environments. These reports provide users with ready to use information as soon as they open the application. They can be modified in terms of what data will or will not be shown through the use of report Views.
Dashboards
Dashboards are connected to your historical data and allow you to see your data in tabular and graphical ways. Dashboards utilize various custom or pre-made elements to display your data. Their design can also vary and be customized depending on your needs. Users can interact with dashboards using filters and settings to show only the needed data.
All the dashboards available to a user are shown on the Dashboards tab.
Users can download the dashboard in a number of formats or subscribe to it to receive periodic updates through one of the chosen channels.
Standard Dashboards are another out-of-the-box asset available in CxEngage Reporting. These dashboards provide users with ready to use information as soon as they open the application.
Report Views
Reports may be comprehensive and contain a large number of options, KPIs, and other metrics that may not always be needed at the same time. For example, if your report has 10 columns, but you only want to show 7 of them, you would typically have to create a copy of the original report and then remove the 3 extra columns. Creating separate reports to accommodate each small change to a report can become difficult to maintain.
This is why reports can be modified to show only the metrics needed for a certain user profile, while still preserving all the data and metrics within the report.
This is done with Report Views, a powerful tool used to facilitate the way users interact with reports, allowing them to focus only on the most relevant information. With this feature you can also control the way a report is displayed, what the report page size is, how the fields are resized, etc.
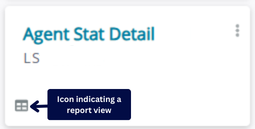
A report view is indicated with the view icon.
Users with Designer and Power Viewer roles can create and work with views. Views function the same way reports do.
Some dashboards also contain readily available standard views, which are another useful component of the out-of-the-box features available with CxEngage Reporting
Styles
Styles are a feature that allows you to define a visual style or look and feel that you want to use across multiple assets. This feature is accessible to all Designer and Power Viewer roles. They can utilize the styles and collections they make to modify what the reports, dashboards, and views they work with look like.
This allows users to create specific styles for different needs, which you can then quickly apply to assets without having to modify all the individual elements by hand.
The styles can be created, modified, deleted, imported, and exported. When a style is changed within the Styles tabs, these changes are also automatically shown in all the assets that the style was applied to, which means that you do not need to make changes in the various places manually.